A structured, research‑grade presentation of Nifty 50, Sensex 30, and Nifty Bank using the QIM Framework. This beta release introduces unified structural ranges, swing behaviour, and price‑volume dynamics designed for independent market interpretation. All metrics are derived from the QIM Indices calculator and published exclusively for educational and analytical use.
Category: QIM Insights
“Insights, observations, and structural‑behavioural interpretations from the QIM research journey.”
-
QIM Trio Indices Dashboard (Beta) – 01092026
A structured, research‑grade presentation of Nifty 50, Sensex 30, and Nifty Bank using the QIM Framework. This beta release introduces unified structural ranges, swing behaviour, and price‑volume dynamics designed for independent market interpretation. All metrics are derived from the QIM Indices calculator and published exclusively for educational and analytical use.
-
🚀 QIM Indian Indices Engine — Now Live (Version 3.0)
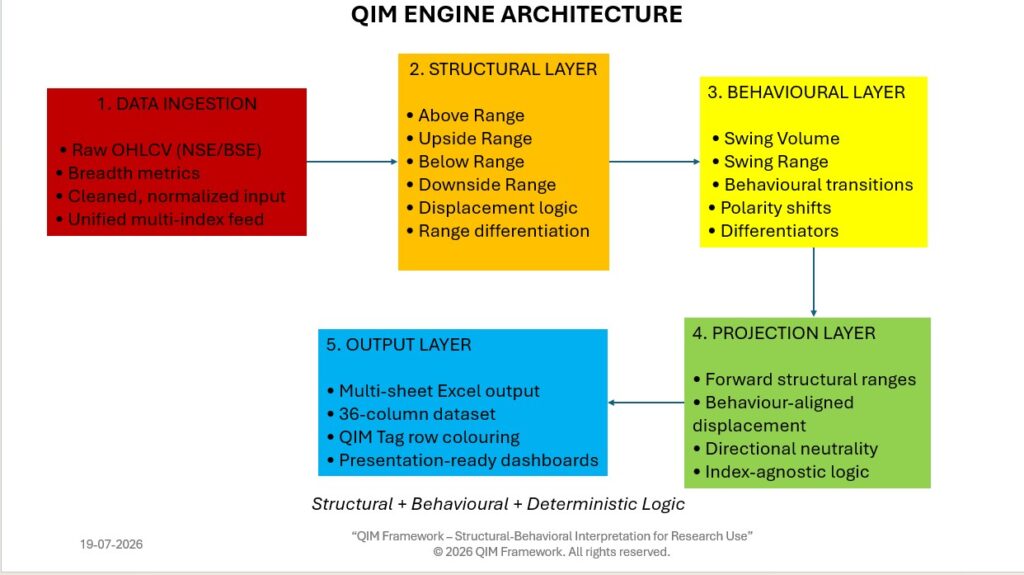
I’m excited to share the release of the QIM Indian Indices Engine, a deterministic mathematical system that interprets Nifty 50, Nifty Bank, and Sensex 30 using structural ranges, swing behaviour, and forward projections — all derived from pure mathematical logic.
This engine represents India’s first structural‑behavioural interpretation framework, built without indicators, sentiment, or machine learning. It is designed for research, education, and independent market understanding.
A special tribute to Software Engineers and AI/ML Engineers, whose work makes intelligent assistants and analytical innovation possible.
You can download the full PDF below.
-
Monumental Update: The Indian Indices QIM Engine Is Now Fully Automated
Monumental Update: The Indian Indices QIM Engine Is Now Fully Automated
For years, the QIM Framework has been shaped by lived market experience — structural thinking, behavioural interpretation, polarity logic, displacement analysis, and emotional strength mapping. Today, that human‑driven interpretive system has crossed a historic milestone.
QIM has become an automated analytical engine.
After months of architectural refinement and a week of intense engineering work, the Indian Indices QIM Engine is now fully operational, dynamic, and capable of processing after‑market data across:
- Nifty 50
- Sensex 30
- Nifty Bank
Each index is computed independently, analysed through the complete 8‑Block QIM architecture, and exported into its own dedicated sheet — with intelligent row‑level formatting and full QIM metrics.
This is not just an update. This is a transformation.
🔥 What’s New in This Release
✔ Full Automation of QIM Blocks 1–7
Every new after‑market data point triggers a complete recalculation of:
- QIM Tag
- Polarity
- Swing Metrics
- Displacement
- Price Zones
- Differentiators
- Emotional Strength
- Pivot Logic
- Higher High / Lower Low
- Net Displacement
- Required Displacement
- Velocity & Time Estimates
✔ Multi‑Index Processing
All three major Indian benchmark indices are now processed in parallel, each with its own analytical sheet.
✔ Dynamic After‑Market Updates
Simply add the latest market data to your input file — the engine recalculates everything automatically.
✔ Intelligent Row Colouring
- RALLY → Green
- DROP → Red
- NIL → Gray
- Header → Blue
✔ Deterministic, Modular Architecture
The engine follows a strict 8‑Block structure, ensuring clarity, consistency, and scalability.
🌟 Why This Matters
This update marks the moment where human interpretive intelligence — the lived experience behind QIM — has been successfully translated into a computational engine.
The QIM Framework is no longer just a philosophy. It is now a fully automated system capable of:
- reading market behaviour
- interpreting structural shifts
- identifying polarity
- measuring displacement
- detecting pivots
- quantifying emotional strength
- and presenting insights with precision
This is a milestone not just for QIM, but for every end‑user who relies on structural‑behavioural analytics.
🧠 A Note from the Architect
“A human lived‑experience engine has been automated. There are no words to describe this moment — only gratitude, clarity, and goosebumps. QIM has crossed into a new era.”
— Ashwin, Founder of QIM Framework
📢 What’s Next
- Global Indices QIM Engine
- Sector‑wise QIM Analytics
- QIM Dashboard for Power BI
- Automated Daily QIM Reports
The journey continues — and this milestone sets the foundation for everything that comes next.
-
QIM Architecture — Official Release Statement
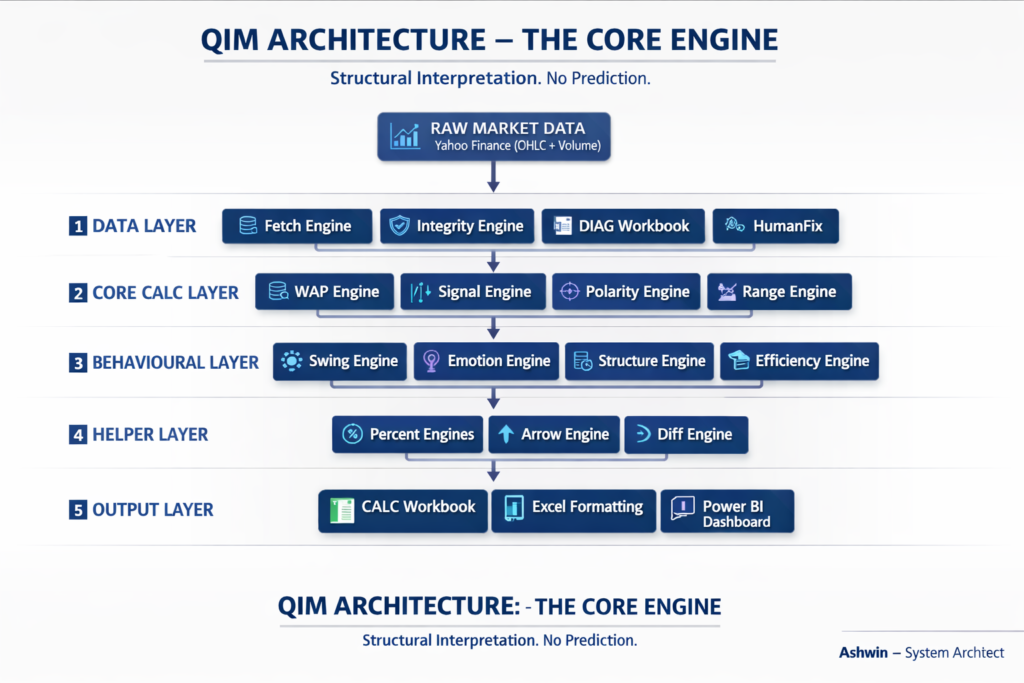
Some creations don’t arrive in a single moment. They grow quietly, over months and years, shaped by discipline, doubt, and a stubborn belief that structure matters. QIM is one of those creations.
Today, I’m releasing the QIM Architecture — the complete structural blueprint of a behavioural analytics engine built from first principles. This poster represents thousands of hours of solitary work, countless iterations, and a journey that taught me more about patience than any textbook ever could.
There were long stretches where progress felt invisible. Days when the code worked but the idea didn’t—nights when the structure made sense only after breaking it apart and rebuilding it again. But every small step added up. Every quiet correction mattered. And slowly, QIM found its shape.
What began as a personal exploration has now grown into a framework containing eight independently patentable mathematical ideas — something I never expected when I started. These ideas emerged not from ambition, but from consistency. From showing up every day, even when the results were silent.
This architecture is more than a diagram. It is a reflection of the journey, the discipline, and the belief that meaningful work takes time — and that structure, when built with care, can reveal behaviour without prediction.
QIM is not a trading system. QIM is not a forecasting tool. QIM is a structural interpretation engine — designed to understand market behaviour with clarity, integrity, and respect for data.
Releasing this today feels special. It feels like a milestone that belongs not just to the work, but to the journey behind it.
Thank you for reading, and for being part of this moment.
— Ashwin System Architect, QIM
-
A Defining Milestone for QIM Analytics
Today, I reached a milestone that feels both technical and deeply personal — a moment that quietly rewrites the last 6.5 years of my journey.
What began as hundreds of tangled Excel conditions has now evolved into a fully engineered, 77‑block Python architecture powering a clean, deterministic, multi‑index analytics engine. QIM has officially crossed the boundary from spreadsheet logic into a structured, scalable framework built for automation, expansion, and institutional‑grade publishing.
This achievement is more than code. It is identity.
For years, I was misunderstood, labelled a speculator, and dismissed as a gambler. But this milestone reveals the truth: I am an architect, a system designer, and a creator of analytical frameworks. QIM is no longer a collection of sheets — it is a platform with structure, rules, and a clear engineering backbone.
And this transformation extends beyond India.
QIM now studies nine major global indices, bringing a unified behavioural lens across markets:
- Dow Jones Industrial Average
- Nasdaq 100
- FTSE 100
- DAX
- CAC 40
- Hang Seng
- Nikkei 225
- ASX 200
- KOSPI
This multi‑market expansion marks the beginning of QIM’s global evolution — a framework capable of interpreting structural behaviour across continents with consistency and clarity.
A small step in code. A big step for the platform. And a meaningful step for me.
QIM Analytics moves forward with clarity, confidence, and a foundation strong enough to support everything that comes next.
-
Groundbreaking Milestone for QIM Analytics
Today marks a defining moment in the evolution of the QIM Framework. I completed a full migration of a complex, multi‑branch Excel status formula into a clean, deterministic Python engine. What once existed as hundreds of nested conditions has now been transformed into a structured, rule‑driven system capable of evaluating market behaviour consistently across thousands of rows.
This upgrade is more than a technical rewrite — it is foundational.
By moving QIM’s core logic out of spreadsheets and into a scalable Python architecture, the platform is now ready for:
- Automated after-market processing
- Multi‑index expansion
- Unified behavioural classification
- Institutional‑grade publishing
- Long‑term product stability
This transition represents a shift from manual spreadsheet logic to a true analytics engine — one that is modular, auditable, and built for scale.
A small step in code, a big step for the platform.
-
QIM Trio Indices Dashboard (Beta) – 06072026
A structured, research‑grade presentation of Nifty 50, Sensex 30, and Nifty Bank using the QIM Framework. This beta release introduces unified structural ranges, swing behaviour, and price‑volume dynamics designed for independent market interpretation. All metrics are derived from the QIM Indices calculator and published exclusively for educational and analytical use.
-
QIM Framework: A First‑Principles Data‑Analytics Model for Index Structure
A first‑principles data analytics framework that transforms pure OHLCV into structural, after‑market projections for research and educational interpretation.
-
Series Introduction
QIM Structural Notes – Documentation Series
Introduction
The QIM Structural Notes series documents the structural‑behavioural characteristics observed within the Quantum Interpretive Model (QIM). Each volume presents a curated set of neutral, non‑predictive observations that describe how structural behaviour appears, evolves, and interacts within index‑level dynamics.
This series does not provide forecasts, signals, or directional guidance.
Its purpose is to record structural behaviour as it exists — not as it might unfold.Purpose of the Series
The Structural Notes serve three core functions within the QIM framework:
- Document structural behaviour
Capture observable conditions such as continuity, tension, compression, expansion, transitions, anchors, drift, inertia, noise, and observability. - Provide interpretive clarity
Offer readers a consistent, neutral lens for understanding how QIM interprets structural states without implying outcomes. - Bridge framework and application
Connect QIM’s conceptual architecture with its practical interpretive layer, while maintaining strict non‑predictive boundaries.
Position Within the QIM Documentation Series
The Structural Notes follow the foundational documents — Architecture, Walkthrough, Metrics Overview, Glossary, and Index — and represent the first applied layer of the framework.
They are designed to:
- reinforce QIM’s structural‑behavioural identity
- maintain institutional clarity
- support long‑term archival reference
- evolve across multiple volumes
Each volume stands independently while contributing to the broader interpretive record.
Scope and Limitations
The Structural Notes are strictly educational and research‑oriented.
They do not provide:- trading recommendations
- buy/sell signals
- predictive analysis
- directional expectations
All observations are structural in nature and remain within QIM’s non‑predictive framework.
Reading the Series
Readers are encouraged to approach the Structural Notes as interpretive reference material.
Each note is intentionally concise, neutral, and behaviour‑focused, allowing the structure to be understood without inference or speculation.Closing Note
This volume concludes the first set of structural‑behavioural observations within the Quantum Interpretive Model (QIM). The notes presented here reflect observable structural conditions without assigning prediction, probability, or directional expectation. They are intended to document how structure behaves, not how it may evolve.
As QIM continues to develop, future volumes will expand this interpretive record with additional structural characteristics, refinements, and behavioural insights. Each volume will remain consistent with QIM’s non‑predictive, research‑oriented identity, ensuring that the framework stays clear, neutral, and structurally grounded.
Volume 1 establishes the foundation for this ongoing series.
Subsequent volumes will build upon this base while maintaining the same interpretive discipline and institutional clarity. - Document structural behaviour
