This section explains the concepts behind QIM, including structural boundaries, behavioural deflection, emotional strength, upside/downside zones, and the interpretation method. It serves as the reference guide for understanding how the dashboards are constructed and how to read them.
QIM Framework Automation Architecture
Block 1 — Data Cleaning & Standardisation | Block 2 — QIM Tag Processing
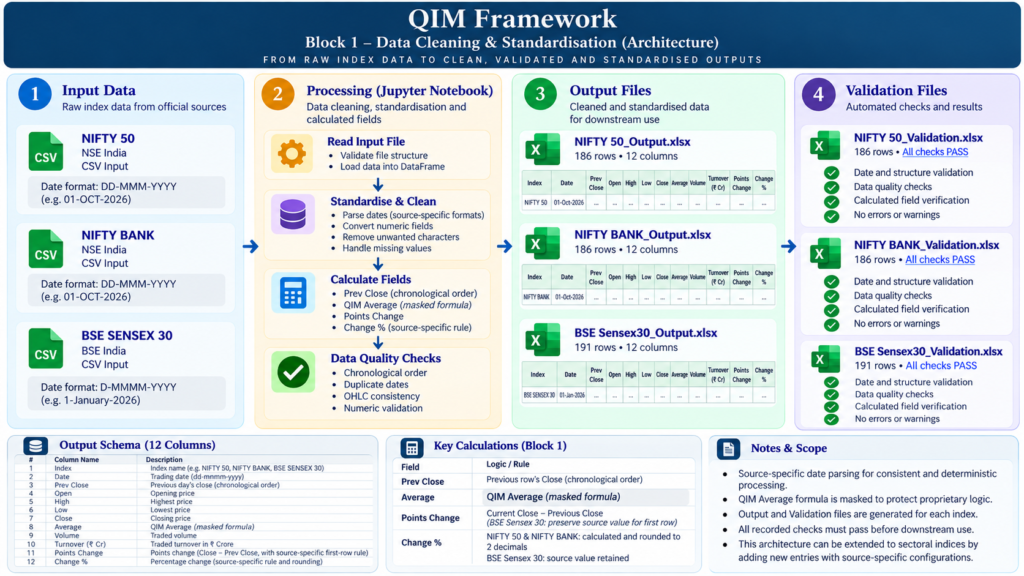
The QIM Framework Automation architecture establishes a structured workflow for transforming raw index data into cleaned, standardised and validated outputs, followed by the application of QIM’s defined conditional logic to generate a QIM Tag for each trading day.
The two blocks form the initial stages of the QIM automation pipeline, with each block performing a distinct function within the broader framework.
Block 1: Data Cleaning & Standardisation
Objective: To process raw historical index data into a consistent, structured format suitable for downstream QIM calculations and analysis.
Block 1 processes data for three Indian benchmark indices:
- Nifty 50
- Nifty Bank
- BSE Sensex 30
The workflow begins with source-specific CSV inputs and applies data cleaning, standardisation, transformation and validation through a Python-based processing workflow implemented in a Jupyter Notebook.
Processing workflow
- Input data: Read the raw index files and validate their structure.
- Standardisation and cleaning: Parse dates, convert numeric fields, remove unwanted characters and handle missing values.
- Calculated fields: Derive Prev Close, QIM Average, Points Change and Change %, applying the relevant source-specific rules.
- Data-quality checks: Validate chronological order, duplicate dates, OHLC consistency and numeric values.
- Output generation: Produce standardised Excel output files and corresponding validation files for each index.
Outputs and validation
Block 1 generates separate output and validation workbooks for Nifty 50, Nifty Bank and BSE Sensex 30. The standardised output schema contains 12 columns, providing a consistent data structure for subsequent processing.
Independent validation files record the results of structural, data-quality and calculated-field checks. The architecture requires recorded checks to pass before the outputs proceed to downstream use.
The QIM Average calculation remains proprietary and is not disclosed in the architecture.
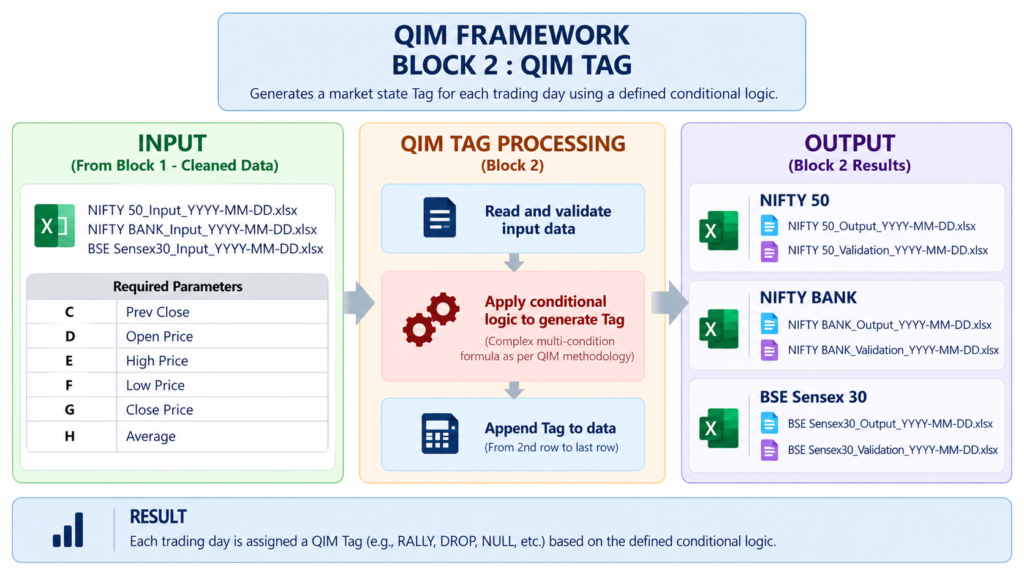
Block 2: QIM Tag Processing
Objective: To apply QIM’s defined conditional logic to cleaned index data and generate a QIM Tag for each trading day.
Block 2 uses the standardised data produced by Block 1 as its input. It reads and validates the input files, applies the specified multi-condition logic, and appends the resulting QIM Tag to the relevant data.
Processing workflow
- Input validation: Read the cleaned index workbooks and validate the required input data.
- Conditional logic: Apply the defined QIM Tag formulation using the required input fields.
- Tag generation: Generate the corresponding QIM Tag for each applicable trading-day record.
- Output generation: Produce index-specific output and validation files for Nifty 50, Nifty Bank and BSE Sensex 30.
The required parameters include Prev Close, Open, High, Low, Close, and Average. The conditional formulation follows the QIM methodology; its proprietary calculation logic is not disclosed in the architecture.
Result
Each applicable trading-day record receives a QIM Tag based on the defined conditional logic. The generated outputs are organised into separate index-specific workbooks, accompanied by corresponding validation files.
Integrated Architecture
Block 1 establishes the data foundation through cleaning, standardisation and validation. Block 2 builds on that foundation by applying QIM’s conditional logic to generate the QIM Tag.
Together, these blocks establish an initial processing pipeline in which data preparation precedes rule-based interpretation, with structured outputs supporting subsequent stages of the QIM Framework Automation.
The architecture is designed to support systematic processing across the three benchmark indices while maintaining distinct processing responsibilities, reproducible outputs, and validation checkpoints.
Design Principles
- Standardise first: Establish a consistent data structure before downstream processing.
- Validate independently: Use dedicated validation outputs to assess data quality and calculated fields.
- Apply defined logic: Implement the specified QIM methodology without disclosing proprietary formulations.
- Process systematically: Maintain distinct inputs, processing steps, outputs and validation records for each index.
- Build incrementally: Extend the automation framework through interconnected blocks with clearly defined responsibilities.
QIM Framework — Structured Data. Defined Logic. Systematic Processing.
QIM Framework — Block 1 Architecture
Data Cleaning, Structural Organization and Transformation
QIM Framework – Indices Calculator
Block 1 | Architecture & Data Processing
1. Overview
Block 1 forms the data preparation and standardization layer of the QIM Framework – Indices Calculator.
Its primary purpose is to transform source-specific market data into a structured, standardized, and validated dataset suitable for subsequent QIM processing blocks.
The architecture is designed to maintain a clear separation between:
- Data ingestion
- Data cleaning
- Structural organization
- Transformation
- Output preparation
- Independent validation
Block 1 currently accommodates three index data structures:
- BSE Sensex 30
- NIFTY 50
- NIFTY BANK
Each source may have differences in column structure, naming conventions, and data representation. Source-specific handling is therefore incorporated within the processing architecture.
2. Block 1 Architecture
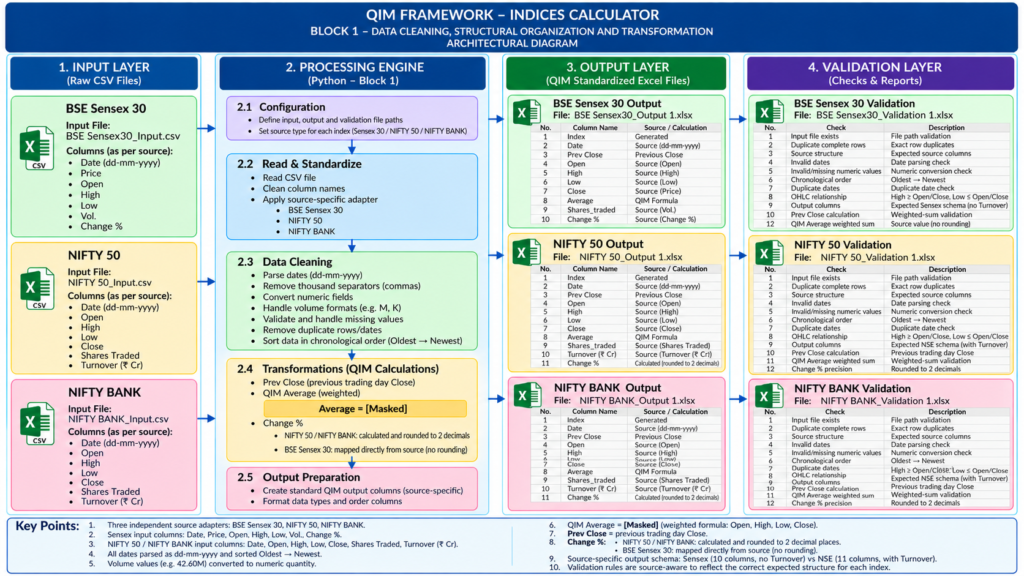
[INSERT ARCHITECTURE DIAGRAM HERE]
Figure 1 — QIM Framework Indices Calculator: Block 1 architectural diagram.
The architecture follows the overall flow:
Raw CSV Input → Processing Engine → Standardized QIM Output → Independent Validation
The output generated by Block 1 is designed to become the input interface for the subsequent QIM processing block.
3. Input Layer
The Input Layer consists of raw CSV files obtained from the respective market-data sources.
BSE Sensex 30
The source structure includes:
- Date
- Price
- Open
- High
- Low
- Volume
- Change %
NIFTY 50
The source structure includes:
- Date
- Open
- High
- Low
- Close
- Shares Traded
- Turnover (₹ Cr)
NIFTY BANK
The source structure includes:
- Date
- Open
- High
- Low
- Close
- Shares Traded
- Turnover (₹ Cr)
Because the source structures are not identical, Block 1 uses source-specific adapters before the data enters the common processing flow.
4. Processing Engine
The Block 1 processing engine is organized into five stages.
4.1 Configuration
The configuration layer establishes:
- Input file paths
- Output file paths
- Validation file paths
- Source type for each index
This allows the same architectural framework to accommodate different source structures without changing the overall processing flow.
4.2 Read and Standardize
The source files are read and prepared for processing.
This stage includes:
- Reading the CSV data
- Cleaning column names
- Identifying the source structure
- Applying the appropriate source-specific adapter
The objective is to bring different source structures into a consistent processing framework.
4.3 Data Cleaning
The data-cleaning stage prepares the source data for analytical processing.
Key operations include:
- Parsing dates into a consistent format
- Removing thousand separators where applicable
- Converting numeric fields into appropriate numeric quantities
- Handling volume representations such as M and K
- Identifying missing or invalid values
- Removing duplicate rows or dates
- Sorting observations chronologically from Oldest → Newest
This stage establishes the structural integrity of the dataset before transformations are applied.
4.4 Transformation
The transformation layer generates the required derived fields for the standardized QIM dataset.
These include:
- Previous Close
- QIM Average
- Change %
The proprietary QIM calculation contained within the QIM Average field is intentionally not disclosed in this public documentation.
Proprietary Methodology Notice:
The QIM Framework incorporates proprietary analytical logic and formulations. The mathematical formulation underlying the QIM calculation is intentionally withheld from this public architectural documentation. This page presents the engineering architecture, data flow, and validation structure without disclosing proprietary methodology.
For NIFTY 50 and NIFTY BANK, Change % is calculated and presented to two decimal places.
For BSE Sensex 30, the source Change % is mapped directly without additional rounding.
5. Output Layer
Following processing and transformation, Block 1 produces standardized QIM Excel output files for each index.
The standardized output contains the required fields for subsequent processing.
The output structure is source-specific where necessary while maintaining a common QIM processing architecture.
The three output datasets are:
- BSE Sensex 30 Output
- NIFTY 50 Output
- NIFTY BANK Output
These files form the data interface to the next stage of the QIM Framework – Indices Calculator.
6. Independent Validation Layer
Validation is maintained as a separate layer rather than being treated simply as an output of the processing engine.
The validation layer checks the integrity of both the input data and the standardized output.
Key validation areas include:
- Input file existence
- Duplicate complete rows
- Source structure
- Date validity
- Missing or invalid numeric values
- Chronological ordering
- Duplicate dates
- OHLC relationships
- Expected output columns
- Previous Close calculation
- QIM calculation field validation
- Change % precision
Separate validation workbooks are maintained for the three indices.
This provides an independent verification layer between data preparation and subsequent QIM processing.
7. Source-Specific Architecture
Although the three indices follow a common processing architecture, their source structures are not assumed to be identical.
The architecture therefore follows a common framework with source-specific adapters.
This approach allows:
Different source structures → Source-specific handling → Common processing architecture → Standardized QIM output
This separation is intended to improve maintainability as additional index datasets are incorporated into the framework.
8. Block 1 Design Principle
The fundamental design principle of Block 1 is:
Standardize first. Validate independently. Process subsequently.
The block is therefore not intended to perform the complete QIM analytical workflow.
Its role is to establish a clean, structured, chronologically organized, and validated data interface for the next processing stage.
9. Block Interface
Block 1 is designed as the first stage of a modular processing architecture.
Input
Raw source CSV files
↓
Block 1
Data Cleaning
Structural Organization
Transformation
Validation
↓
Output
Standardized QIM dataset
↓
Next Block
Subsequent QIM processing
This creates a defined interface between individual blocks and allows each stage to be developed and validated independently.
10. Intellectual Property and Disclosure
The architecture shown on this page represents the engineering and processing structure of Block 1.
The QIM Framework’s proprietary mathematical formulations, calculation logic, and implementation details are not disclosed.
Accordingly, this documentation intentionally focuses on:
- System architecture
- Data flow
- Data preparation
- Transformation structure
- Validation methodology
- Block-to-block interfaces
It does not disclose the proprietary mathematical formulation underlying the QIM calculations.
11. Status
Block: 1 of the QIM Framework – Indices Calculator
Component: Data Cleaning, Structural Organization and Transformation
Architecture Status: Completed
Output: Standardized QIM datasets with independent validation
Next Stage: Subsequent QIM processing block
About the documentation
This page documents the engineering architecture of the QIM Framework without exposing proprietary mathematical formulations.
The architecture will evolve progressively as additional QIM processing blocks are developed, validated, and integrated.
Release Notes – QIM Indian Indices Engine (Python Automated Edition v3.0)
Version: 3.0
Release Date: September 2026
Status: Stable Release
Engine: QIM Indian Indices Engine (Python Edition)
Overview
This release marks the successful migration of the QIM Indian Indices Engine from a multi‑sheet Excel workflow to a fully automated Python system. The new engine executes structural‑behavioural analysis for Nifty 50, Nifty Bank, and Sensex 30 with deterministic accuracy and significantly improved performance.
New Features
1. Full Python Automation (All 8 Blocks)
Complete translation of the QIM architecture into Python, covering:
- Foundation & structural base
- QIM Tag & polarity logic
- Swing metrics & emotional strength
- Displacement & time metrics
- Structural price zones
- Behavioural differentiators
- Presentation formatting
- Multi‑index output generation
2. Multi‑Sheet Excel Output
Automated generation of:
- Nifty 50 sheet
- Nifty Bank sheet
- Sensex 30 sheet
Each sheet includes the full 36‑column QIM dataset.
3. Deterministic Behavioural Engine
Includes:
- Swing Range
- Swing Volume
- Polarized Volume
- Emotional Strength
- Pivot
All computed using forward‑rolling deterministic logic.
4. Structural Price Zone Computation
Automated calculation of:
- Above Range
- Upside Range
- Below Range
- Downside Range
Performance Improvements
Before (Excel):
Manual workflow requiring ~30 minutes per index.
After (Python):
Automated workflow requiring ~5 minutes for all three indices combined.
This represents a 6× improvement in computation efficiency.
Bug Fixes & Stability Enhancements
1. Volume Contamination Fix
Resolved repeated TypeError: int + str through:
- comma removal
- whitespace stripping
- numeric coercion
- NaN replacement
- segment‑safe cleaning inside Block 3
2. Structural Tag Transition Fix
Corrected mis‑tagging between RALLY and DROP states.
3. Segment Boundary Stability
Integrated cleaning logic directly inside Block 3 to prevent unclean slices.
4. Excel Writer Reliability
Unified sheet‑mapping to prevent openpyxl naming conflicts.
5. Emotional Strength Optimization
Improved rolling window performance for large forward ranges.
Known Issues
None in this release. Engine tested across all three indices with stable output.
Future Roadmap
- QIM Equity Engine
- QIM Sector Engine
- Global Indices Engine
- Real‑time structural updates
- API‑based ingestion
- QIM Dashboard (Web + Mobile)
- Behavioural anomaly detection modules
Release Summary
Version 3.0 represents a major milestone for the QIM Framework — transforming a manual Excel‑based analytical system into a deterministic, scalable, and high‑performance Python engine. This release establishes the foundation for future QIM analytical modules and platform‑level automation.
Architecture
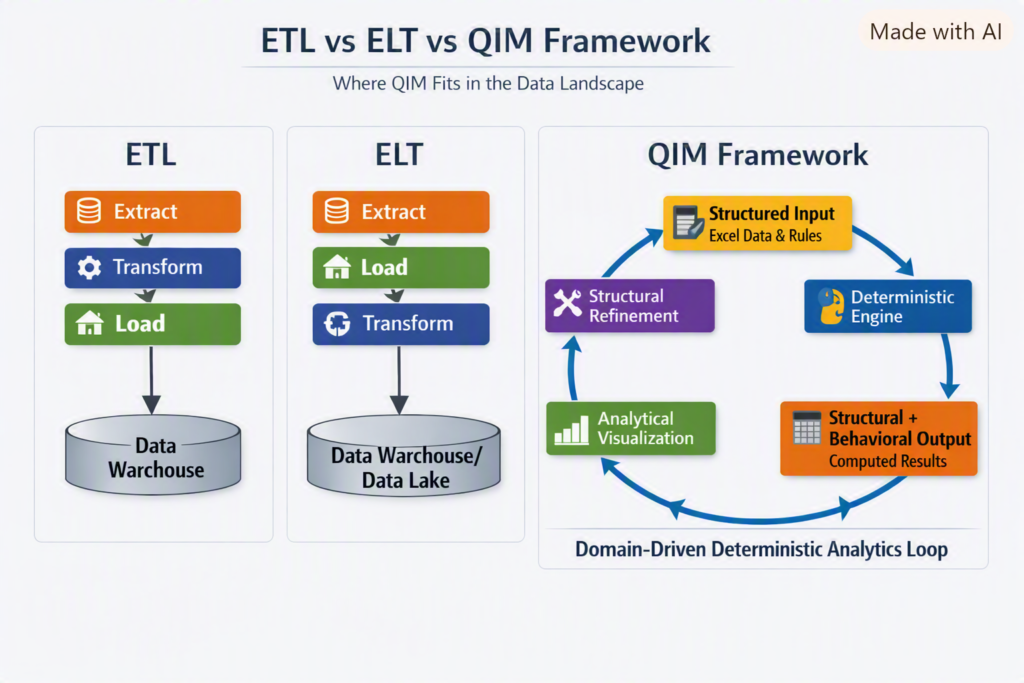
QIM is an independently developed analytics architecture that reflects my approach to deterministic structural analysis.