Retrospective Market Behaviour Interpreted Through the QIM Framework
QIM Trio Indices Case Study – Projection vs Actual Alignment (29 Sep 2026)
A structural‑behavioural comparison across Nifty 50, Nifty Bank, and Sensex 30 using the QIM Framework
This case study evaluates how closely the QIM Framework’s downside projections aligned with actual index values across Nifty 50, Nifty Bank, and Sensex 30 on 29 September 2026. Using model‑derived structural reference levels and observed market outcomes, the analysis shows exceptionally tight alignment — with deviations of 0.118%, 0.111%, and 0.189% respectively. These results highlight the consistency of QIM’s structural‑behavioural methodology while reinforcing its intended use for research and educational interpretation, not trading signals. Readers are encouraged to view this comparison alongside the full QIM dashboards for contextual understanding.
Case Study: Nifty 50 11-09-2026
QIM Case Study – Nifty 50 (Aug–Sep 2026). On 21 August 2026, QIM’s downside boundary for Nifty 50 was 23,329.74. On 11 September 2026, the index recorded a low of 23,231.40 — validating the structural projection with remarkable accuracy.
This projection arrived 16 trading sessions in advance, demonstrating the deterministic nature of QIM’s structural‑behavioural methodology.
QIM projections are structural and non‑predictive. They do not represent trading signals or advice. They represent mathematical boundaries the market eventually respects.
Case Study: Structural Behaviour of Dow Jones on 17 April 2026
How QIM Structural Metrics Aligned with the Upper Displacement Zone Near 52,000
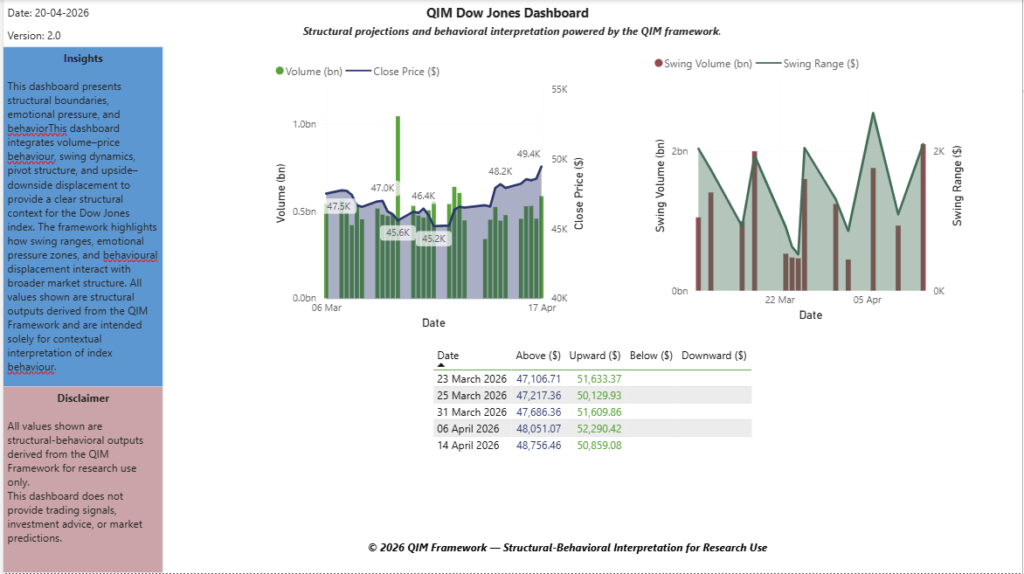
On 17 April 2026, the QIM Framework indicated a clear upward displacement zone in the Dow Jones index. Structural boundaries, swing‑range expansion, and volume–price behaviour collectively highlighted pressure toward the upper structural band. The subsequent test of the region near 52,000 illustrates how structural metrics, behavioural displacement, and emotional pressure zones can align with broader market movement.
This case study demonstrates the interpretive value of non‑predictive structural analytics, showing how the QIM Framework contextualizes index behaviour through volume dynamics, swing structure, pivot alignment, and upside–downside displacement. All values are structural outputs intended solely for research interpretation and do not represent trading signals or investment advice.