A structured, research‑grade presentation of Nifty 50, Sensex 30, and Nifty Bank using the QIM Framework. This beta release introduces unified structural ranges, swing behaviour, and price‑volume dynamics designed for independent market interpretation. All metrics are derived from the QIM Indices calculator and published exclusively for educational and analytical use.
Tag: Nifty Bank
-
🚀 QIM Indian Indices Engine — Now Live (Version 3.0)
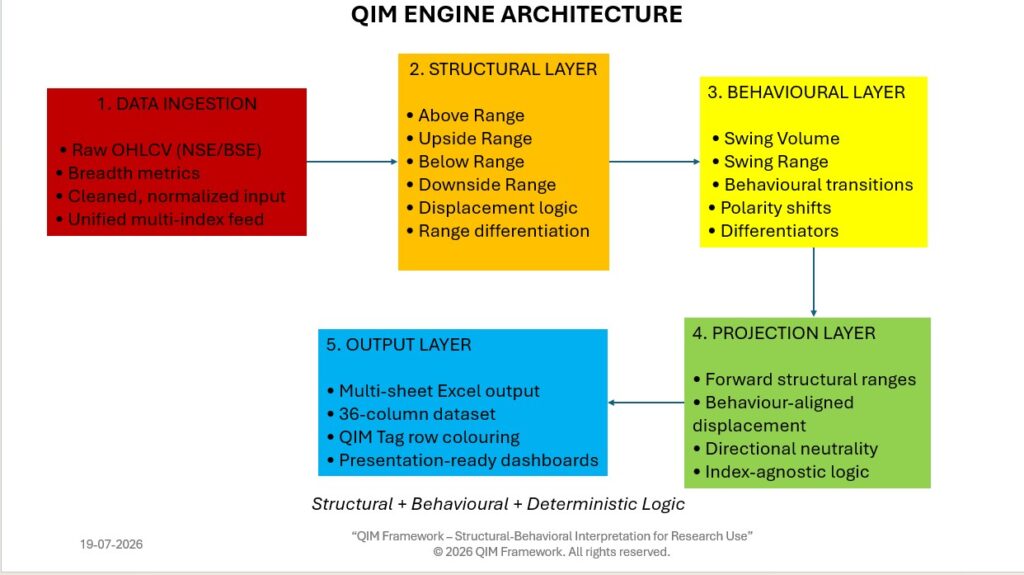
I’m excited to share the release of the QIM Indian Indices Engine, a deterministic mathematical system that interprets Nifty 50, Nifty Bank, and Sensex 30 using structural ranges, swing behaviour, and forward projections — all derived from pure mathematical logic.
This engine represents India’s first structural‑behavioural interpretation framework, built without indicators, sentiment, or machine learning. It is designed for research, education, and independent market understanding.
A special tribute to Software Engineers and AI/ML Engineers, whose work makes intelligent assistants and analytical innovation possible.
You can download the full PDF below.
-
QIM Trio Indices Dashboard (Beta) – 20072026
We created a unified engine that converts raw index data into structural ranges, swing behaviour, and forward projections — all derived from pure mathematical logic. This marks the first complete structural‑behavioral interpretation system for India’s major indices.
A structured, research‑grade presentation of Nifty 50, Sensex 30, and Nifty Bank using the QIM Framework. This beta release introduces unified structural ranges, swing behaviour, and price‑volume dynamics designed for independent market interpretation. All metrics are derived from the QIM Indices calculator and published exclusively for educational and analytical use.
-
QIM Trio Indices Dashboard (Beta) – 10-07-2026
A structured, research‑grade presentation of Nifty 50, Sensex 30, and Nifty Bank using the QIM Framework. This beta release introduces unified structural ranges, swing behaviour, and price‑volume dynamics designed for independent market interpretation. All metrics are derived from the QIM Indices calculator and published exclusively for educational and analytical use.
-
QIM Trio Indices Dashboard (Beta)- 09-07-2026
A structured, research‑grade presentation of Nifty 50, Sensex 30, and Nifty Bank using the QIM Framework. This beta release introduces unified structural ranges, swing behaviour, and price‑volume dynamics designed for independent market interpretation. All metrics are derived from the QIM Indices calculator and published exclusively for educational and analytical use.
-
QIM Trio Indices Dashboard (Beta)-08-07-2026
A structured, research‑grade presentation of Nifty 50, Sensex 30, and Nifty Bank using the QIM Framework. This beta release introduces unified structural ranges, swing behaviour, and price‑volume dynamics designed for independent market interpretation. All metrics are derived from the QIM Indices calculator and published exclusively for educational and analytical use.
-
QIM Trio Indices Dashboard (Beta) – 07-07-2026
A structured, research‑grade presentation of Nifty 50, Sensex 30, and Nifty Bank using the QIM Framework. This beta release introduces unified structural ranges, swing behaviour, and price‑volume dynamics designed for independent market interpretation. All metrics are derived from the QIM Indices calculator and published exclusively for educational and analytical use.
-
Unified Indices Projections — QIM Structural & Behavioral Market Dashboard – 06072026
Price–Volume Dynamics and Structural Projections for Nifty 50, Sensex 30 & Nifty Bank
This presentation brings together the unified structural‑behavioral analytics of India’s three core equity benchmarks — Nifty 50, Sensex 30, and Nifty Bank.
Using the QIM Framework, the dashboards present price–volume dynamics, swing behaviour, and independent structural projections for research and educational interpretation. Each index is visualized with clean, after‑market charts and non‑predictive ranges, consistent with QIM’s principle that market behaviour evolves continuously, and interpretation is left to the user.
The unified layout offers a comparative perspective across indices, enabling analysts to study structural boundaries, displacement ranges, and volume‑driven behaviour without directional bias.