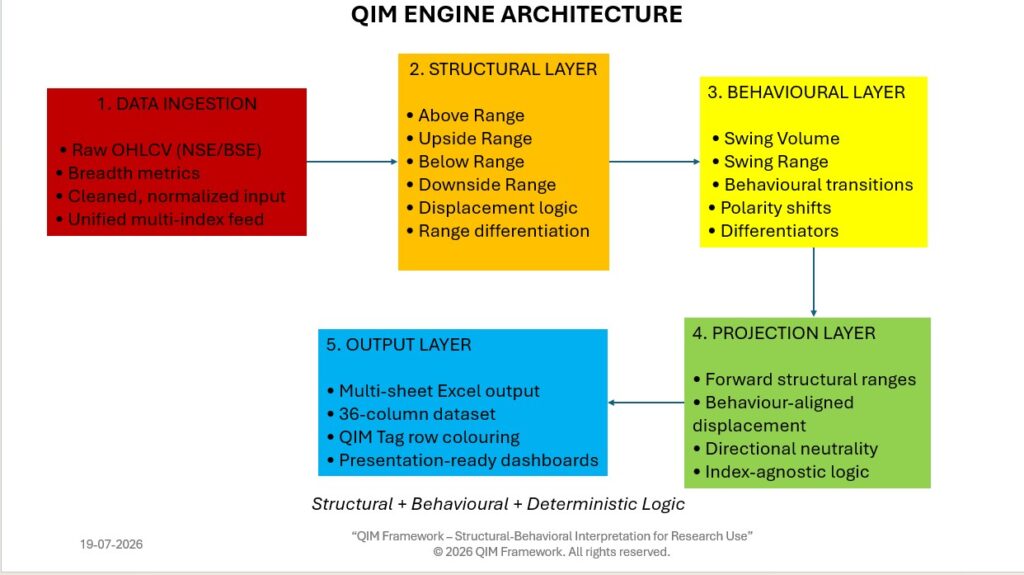
Tag: QIM Framework

  • QIM Framework: A First‑Principles Data‑Analytics Model for Index Structure

    A first‑principles data analytics framework that transforms pure OHLCV into structural, after‑market projections for research and educational interpretation.

  • Global Equity Indices Suite — Structural and Behavioral Dashboards Across Eight Major Markets — 20-04-2026

    A consolidated nine‑dashboard analytical suite presenting non‑predictive structural‑behavioral metrics and projection layouts powered by the QIM Framework.

  • Global Equity Indices Suite — Structural and Behavioral Dashboards Across Eight Major Markets

    A consolidated nine‑dashboard analytical suite presenting non‑predictive structural‑behavioral metrics and projection layouts powered by the QIM Framework.

    This presentation introduces a comprehensive global suite of nine dashboards built on the QIM Framework, integrating structural‑behavioral analysis across eight major equity indices. The suite standardizes volume–price dynamics, liquidity pressure, swing behavior, emotional displacement, and projection structures within a unified methodological format. Each dashboard reflects non‑predictive structural outputs designed for research‑grade interpretation, enabling consistent comparative assessment across markets. The Global Equity Indices Suite positions the QIM Framework as a coherent, institutionally aligned analytical construct for multi‑market structural evaluation.

    The release of this nine‑dashboard suite establishes a unified global structure for ongoing QIM research. By standardizing analytical outputs across eight major equity indices and their corresponding projection layouts, the framework now supports a consistent, comparative view of market behavior at scale. This publication represents the foundation for a broader multi‑market research program, with future updates focused on methodological refinement, expanded coverage, and deeper structural integration across key Global Indices

    No comments on Global Equity Indices Suite — Structural and Behavioral Dashboards Across Eight Major Markets
  • How the QIM Dashboard Works

    A structural‑behavioural interpretation powered by the QIM Behavioral Deflection Model.

    No comments on How the QIM Dashboard Works
  • Series Introduction

    QIM Structural Notes – Documentation Series

    Introduction

    The QIM Structural Notes series documents the structural‑behavioural characteristics observed within the Quantum Interpretive Model (QIM). Each volume presents a curated set of neutral, non‑predictive observations that describe how structural behaviour appears, evolves, and interacts within index‑level dynamics.

    This series does not provide forecasts, signals, or directional guidance.
    Its purpose is to record structural behaviour as it exists — not as it might unfold.

    Purpose of the Series

    The Structural Notes serve three core functions within the QIM framework:

    1. Document structural behaviour
      Capture observable conditions such as continuity, tension, compression, expansion, transitions, anchors, drift, inertia, noise, and observability.
    2. Provide interpretive clarity
      Offer readers a consistent, neutral lens for understanding how QIM interprets structural states without implying outcomes.
    3. Bridge framework and application
      Connect QIM’s conceptual architecture with its practical interpretive layer, while maintaining strict non‑predictive boundaries.

    Position Within the QIM Documentation Series

    The Structural Notes follow the foundational documents — Architecture, Walkthrough, Metrics Overview, Glossary, and Index — and represent the first applied layer of the framework.

    They are designed to:

    • reinforce QIM’s structural‑behavioural identity
    • maintain institutional clarity
    • support long‑term archival reference
    • evolve across multiple volumes

    Each volume stands independently while contributing to the broader interpretive record.

    Scope and Limitations

    The Structural Notes are strictly educational and research‑oriented.
    They do not provide:

    • trading recommendations
    • buy/sell signals
    • predictive analysis
    • directional expectations

    All observations are structural in nature and remain within QIM’s non‑predictive framework.

    Reading the Series

    Readers are encouraged to approach the Structural Notes as interpretive reference material.
    Each note is intentionally concise, neutral, and behaviour‑focused, allowing the structure to be understood without inference or speculation.

    Closing Note

    This volume concludes the first set of structural‑behavioural observations within the Quantum Interpretive Model (QIM). The notes presented here reflect observable structural conditions without assigning prediction, probability, or directional expectation. They are intended to document how structure behaves, not how it may evolve.

    As QIM continues to develop, future volumes will expand this interpretive record with additional structural characteristics, refinements, and behavioural insights. Each volume will remain consistent with QIM’s non‑predictive, research‑oriented identity, ensuring that the framework stays clear, neutral, and structurally grounded.

    Volume 1 establishes the foundation for this ongoing series.
    Subsequent volumes will build upon this base while maintaining the same interpretive discipline and institutional clarity.

  • QIM Index — Structural‑Behavioural Reference Index

    Documentation Series — Volume 2 | Framework Reference Map

    The QIM Index is a structured reference map of all core concepts, terms, and interpretive components used across the Quantum Interpretive Model (QIM). It complements the QIM Glossary by providing an alphabetical index of framework elements, cross‑references, and structural‑behavioural linkages that support neutral, non‑predictive interpretation of QIM dashboards. Designed for quick navigation and consistent understanding, the Index serves as a companion reference for all QIM documentation.

    No comments on QIM Index — Structural‑Behavioural Reference Index
  • QIM Dashboard – Product Description

    The QIM Dashboard is a structural‑behavioural analytics interface built using the Quantum Interpretive Model (QIM). It transforms raw market data into clear structural bands, behavioural zones, emotional strength measures, and equilibrium points—presented in a neutral, non‑predictive format. The dashboard does not provide signals, forecasts, or investment advice. It is a data analytics output designed to help users observe how the market is positioned in the present moment.

    Developed by Ashwin Vaidyanathan, an independent Data Analyst, the QIM Dashboard applies analytical modelling and structural interpretation to create a consistent, objective view of market behaviour. It is not a research report or advisory tool. Users interpret the information independently based on their own context and situational awareness.

    The dashboard is currently in beta testing, with ongoing refinements to structure, visual clarity, and interpretive consistency. The future includes offering the QIM Dashboard as a subscription‑based data analytics product once testing and validation are complete.

  • QIM Glossary — Structural‑Behavioural Definitions

    Official Reference Guide for the Quantum Interpretive Model (QIM)

    A concise, neutral glossary covering all structural and behavioural terms used in the Quantum Interpretive Model. Designed to support clear interpretation of QIM dashboards without prediction, signalling, or directional bias.

    No comments on QIM Glossary — Structural‑Behavioural Definitions
  • QIM Dashboard Walkthrough — Parts 1, 2 & 3

    A Structural‑Behavioural Guide to Reading the QIM Projection Layout

    The QIM Dashboard Walkthrough (Parts 1, 2, and 3) provides a complete structural‑behavioural guide to interpreting the QIM Projection Layout. This series explains how each component of the dashboard functions—ranging from structural duration, Upside/Downside projections, and Swing Logic, to the deeper behavioural layers of Emotional Strength and Pivot. Together, these walkthroughs show how QIM represents market behaviour as evolving structural states and emotional conditions, without prescribing directional conclusions or predictive signals. Readers are introduced to the visual cues, behavioural pressures, and structural boundaries that shape the index, enabling interpretation through context, experience, and situational awareness. This combined guide forms the foundation for reading all QIM dashboards with clarity, neutrality, and structural discipline.

    QIM presents structural‑behavioural data without prescribing directional conclusions.
    Market behaviour evolves continuously, and interpretation is therefore left to the reader based on context, experience, and situational awareness.

    Leave a Reply

    Your email address will not be published. Required fields are marked *

  • QIM Framework — Metrics Overview

    Framework Note / Metrics Guide — Version 1.0 (April 2026)

    The QIM Metrics Overview outlines the core structural, behavioural, contextual, and swing‑integrity metrics that power the Quantum Interpretive Model. These metrics translate raw market data into interpretable system states, forming the foundation for QIM’s neutral analytical map. Designed to be non‑predictive and market‑agnostic, the metrics ensure consistent interpretive behaviour across global indices and benchmark Indian indices. Together, they establish the measurement framework that supports QIM’s structural‑behavioural approach and its emphasis on human judgement.

    1. Introduction

    The QIM Framework relies on a structured set of metrics that translate raw market data into interpretable system states. These metrics do not forecast outcomes; instead, they provide a quantum‑inspired interpretive layer that supports human judgment and situational awareness.

    QIM metrics are engineered to be:

    • Non‑predictive
    • Structure‑first
    • Behaviourally sensitive
    • Context‑aware
    • Market‑agnostic

    These principles ensure that QIM remains consistent, scalable, and neutral across market environments.

    2. Metric Categories

    QIM metrics are organized into four primary categories, each serving a distinct interpretive role.

    a. Structural Metrics

    Structural metrics identify the underlying state of the market system. They form the backbone of QIM’s interpretive logic.

    Key structural states include:

    • Compression
    • Expansion
    • Imbalance
    • Structural drift
    • Structural anchoring

    These states help determine the system’s current configuration and potential structural pathways.

    b. Behavioural Metrics

    Behavioural metrics quantify the intensity and direction of market behaviour. They capture how participants respond to structural conditions.

    Examples include:

    • Volume‑driven transitions
    • Sentiment gradients
    • Behavioural acceleration
    • Behavioural exhaustion

    These metrics help assess the strength and sustainability of market behaviour.

    c. Contextual Metrics

    Contextual metrics map structural and behavioural patterns to the prevailing market environment.

    They capture:

    • Macro alignment
    • Sectoral reinforcement
    • Cross‑index resonance
    • Temporal context

    Contextual metrics ensure that QIM’s interpretation remains grounded in broader market dynamics.

    d. Swing Integrity Metrics

    Swing integrity metrics validate the continuity and coherence of market swings.

    They include:

    • Swing fidelity
    • Swing continuity
    • Swing degradation
    • Swing restoration

    These metrics ensure that QIM’s analytical map remains structurally consistent over time.

    3. Metric Integration

    QIM does not treat metrics in isolation. Instead, it integrates them through a layered interpretive engine:

    1. Structural state identification
    2. Behavioural intensity evaluation
    3. Contextual alignment mapping
    4. Swing integrity validation

    This integration produces the neutral analytical map that defines QIM’s interpretive output.

    4. Universality Across Markets

    QIM metrics are intentionally designed to be:

    • Universal across global indices
    • Consistent across benchmark Indian indices
    • Scalable across timeframes
    • Independent of asset‑specific noise

    This universality ensures that QIM behaves predictably across diverse market structures and geographies.

    5. Closing Note

    The QIM Metrics Overview forms the foundation for upcoming framework notes that will detail each metric category, its interpretive role, and its integration into the QIM engine. These metrics are central to QIM’s mission: enabling structural‑behavioural interpretation without prediction.

    © 2026 QIM Framework. All rights reserved. Proprietary Research Material.
    Website: https://qimframework.com